
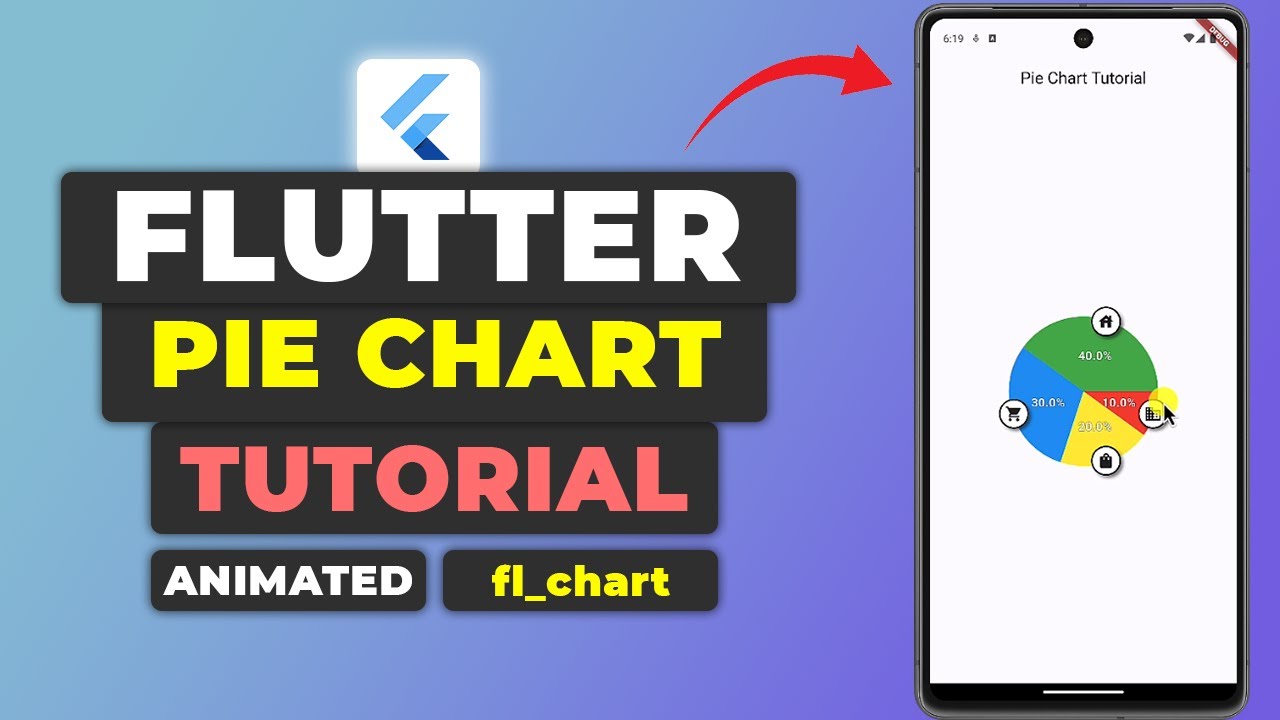
In today’s tutorial, we will delve into the creation of visually appealing pie charts within Flutter using the FL Chart package. The FL Chart package is a powerful tool that allows developers to incorporate a variety of chart types into their Flutter applications. We will walk through the entire process, covering everything from setting up the project to implementing touch interactions and adding custom widgets. By the end of this post, you will possess a comprehensive understanding of how to create and customize pie charts in Flutter.
If you prefer watching a video tutorial on building stunning pie chart in Flutter here is a link to that.
Setting Up the Project
Before we dive into the specifics of creating pie charts, the first step is setting up our Flutter project. This involves adding the necessary dependency, ensuring our project runs without issues, and preparing the initial UI structure.
Adding FL Chart Dependency
The FL Chart package provides robust functionalities for creating various types of charts. To begin, we need to add this package to our Flutter project. Follow these steps:
- Copying Dependency from pub.dev:
- Adding Dependency to pubspec.yaml:
- Open the
pubspec.yamlfile in your project. - Under the
dependenciessection, add the copied FL Chart dependency.
- Open the
- Running flutter pub get:
- Save the changes and run
flutter pub getin your terminal. This will fetch the package and make it available in your project.
- Save the changes and run
dependencies:
  flutter:
    sdk: flutter
      fl_chart: ^0.40.0
flutter pub getTesting App Runs with No Issues
After adding the dependency, it’s crucial to ensure that our application runs without any issues. Run your application on a simulator or a physical device to verify this.
void main() {
  runApp(MyApp());
}

class MyApp extends StatelessWidget {
  @override
  Widget build(BuildContext context) {
    return MaterialApp(
      home: HomePage(),
    );
  }
}

class HomePage extends StatefulWidget {
  @override
  _HomePageState createState() => _HomePageState();
}

class _HomePageState extends State<HomePage> {
  @override
  Widget build(BuildContext context) {
    return Scaffold(
      appBar: AppBar(title: Text('Pie Chart Example')),
      body: Center(child: Text('Flutter Pie Chart')),
    );
  }
}
If the application runs successfully without errors, we can proceed to create our pie chart.
Creating the UI
With our project set up, we can now focus on building the UI. We will create a scaffold for our pie chart by structuring the necessary widgets and properties.
Setting Scaffold Body to buildUI() Function
To keep our code organized, we will delegate the responsibility of building the UI to a separate function called buildUI().
class _HomePageState extends State<HomePage> {
  @override
  Widget build(BuildContext context) {
    return Scaffold(
      appBar: AppBar(title: Text('Pie Chart Example')),
      body: buildUI(),
    );
  }

  Widget buildUI() {
    return Center(
      child: PieChart(
        PieChartData(
          sections: getPieChartSections(),
          // Additional properties will be added here
        ),
      ),
    );
  }
}
Building buildUI()
Within the buildUI() function, we will return a Center widget that contains our PieChart widget.
Widget buildUI() {
  return Center(
    child: PieChart(
      PieChartData(
        sections: getPieChartSections(),
      ),
    ),
  );
}
Adding Sections to the Pie Chart
To create a meaningful pie chart, we need to add sections. Each section represents a slice of the pie chart.
Defining Sections Property on PieChartData
The PieChartData object requires a list of PieChartSectionData objects. We will define a function to generate this list.
List<PieChartSectionData> getPieChartSections() {
  return List.generate(4, (index) {
    final isTouched = false; // This will be updated later
    final double radius = 100.0;

    return PieChartSectionData(
      value: (index + 1) * 10.0,
      title: '${(index + 1) * 10}%',
      color: sectionColors[index],
      radius: radius,
    );
  });
}
Generating List with List.generate()
The List.generate() function helps create a list with a specified number of elements. In our case, we will generate four sections.
List<PieChartSectionData> getPieChartSections() {
  return List.generate(4, (index) {
    final isTouched = false;
    final double radius = 100.0;

    return PieChartSectionData(
      value: (index + 1) * 10.0,
      title: '${(index + 1) * 10}%',
      color: sectionColors[index],
      radius: radius,
    );
  });
}
The value property determines the percentage each section occupies. The title property displays the percentage on each slice, and the color property sets the color.
Styling the Pie Chart
Styling is crucial for enhancing the visual appeal of our pie chart. We will remove inner spacing, increase the overall size, and style the titles.
Removing Inner Spacing
By default, the pie chart has a center space and space between sections. We will remove these.
PieChartData(
  sections: getPieChartSections(),
  centerSpaceRadius: 0.0,
  sectionsSpace: 0.0,
),
Increasing Overall Size
For adjusting the size of the pie chart, we can set the radius property.
double radius = 100.0;

PieChartSectionData(
  value: (index + 1) * 10.0,
  title: '${(index + 1) * 10}%',
  color: sectionColors[index],
  radius: radius,
);
Styling Titles
We can customize the style of the titles by defining the TextStyle property.
TextStyle titleStyle = TextStyle(
  fontSize: 16.0,
  fontWeight: FontWeight.bold,
  color: Colors.white,
);

PieChartSectionData(
  value: (index + 1) * 10.0,
  title: '${(index + 1) * 10}%',
  color: sectionColors[index],
  radius: radius,
  titleStyle: titleStyle,
);
Adding Badge Widgets to Sections
Custom widgets can provide additional information or functionality to each section of the pie chart. Let’s create and add badge widgets.
Creating CustomBadge Widget Class
We will define a CustomBadge class that will be used as the badge widget for each section.
class CustomBadge extends StatelessWidget {
  final IconData icon;
  final double size;
  final Color borderColor;

  CustomBadge({required this.icon, required this.size, required this.borderColor});

  @override
  Widget build(BuildContext context) {
    return Container(
      width: size,
      height: size,
      decoration: BoxDecoration(
        border: Border.all(color: borderColor, width: 2.0),
        shape: BoxShape.circle,
      ),
      child: Icon(icon, size: size / 2),
    );
  }
}
Setting badgeWidget Property on PieChartSectionData
We can now use the CustomBadge widget as the badge for each section.
PieChartSectionData(
  value: (index + 1) * 10.0,
  title: '${(index + 1) * 10}%',
  color: sectionColors[index],
  radius: radius,
  titleStyle: titleStyle,
  badgeWidget: CustomBadge(
    icon: sectionIcons[index],
    size: widgetSize,
    borderColor: Colors.black,
  ),
);
Defining WidgetSize Variable
The widgetSize defines the size of the badge widget.
double widgetSize = 40.0;Creating List of Icons
We will create a list of icons corresponding to each section.
List<IconData> sectionIcons = [
  Icons.business,
  Icons.shopping_bag,
  Icons.local_grocery_store,
  Icons.home,
];
Setting Badge Position Percentage Offset
The badgePositionPercentageOffset property helps in positioning the badge widget.
PieChartSectionData(
  // Other properties
  badgePositionPercentageOffset: 0.98,
);
Implementing Touch Handling
Touch interactions can make the pie chart more interactive and user-friendly. We will implement touch handling to detect touches on the pie chart sections.
Adding pieTouchData to PieChartData
We will add the pieTouchData property to the PieChartData.
PieChartData(
  sections: getPieChartSections(),
  pieTouchData: PieTouchData(
    touchCallback: (pieTouchResponse) {
      // Handle touch interactions
    },
  ),
),
Setting touchCallback
The touchCallback function is triggered whenever a section is touched.
touchCallback: (pieTouchResponse) {
  if (pieTouchResponse.touchInput is FlLongPressEnd || pieTouchResponse.touchInput is FlPanEnd) {
    // Handle touch end
    setState(() {
      touchedIndex = -1;
    });
  } else {
    setState(() {
      touchedIndex = pieTouchResponse.touchedSectionIndex;
    });
  }
},
Modifying Section Style When Touched
We will modify the style of the touched section by checking if the current index matches the touched index.
List<PieChartSectionData> getPieChartSections() {
  return List.generate(4, (index) {
    final isTouched = index == touchedIndex;
    final double radius = isTouched ? 150.0 : 100.0;
    final double fontSize = isTouched ? 24.0 : 16.0;
    final double widgetSize = isTouched ? 60.0 : 40.0;

    return PieChartSectionData(
      value: (index + 1) * 10.0,
      title: '${(index + 1) * 10}%',
      color: sectionColors[index],
      radius: radius,
      titleStyle: TextStyle(fontSize: fontSize, fontWeight: FontWeight.bold, color: Colors.white),
      badgeWidget: CustomBadge(
        icon: sectionIcons[index],
        size: widgetSize,
        borderColor: Colors.black,
      ),
      badgePositionPercentageOffset: 0.98,
    );
  });
}
Get Source Code for free:
Conclusion
Creating pie charts in Flutter using the FL Chart package offers a wealth of customization options. We have covered the essential steps, from setting up the project to implementing touch interactions. By leveraging the powerful features of the FL Chart package, you can create stunning and interactive pie charts for your applications. Keep exploring and experimenting with different configurations to fully unleash the potential of pie charts in Flutter. Stay tuned for more tutorials on creating other types of charts such as bar charts, line charts, and scatter charts. Happy coding!


Leave a Reply